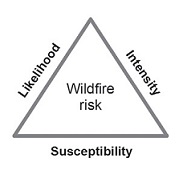
Wildfire risk is the product of the likelihood of a fire occurring (likelihood), the associated fire behavior when a fire occurs (intensity), and the effects of the fire (susceptibility) on highly valued resources and assets (Calkin et al. 2010, Finney 2005, Scott 2006, Scott et al. 2013). Wildfire risk mitigation is achieved when any of the three aspects are reduced.

Wildfire risk triangle. Figure 1 from Scott et al. 2013.
The wildfire risk assessment framework is comprised of four primary components: 1) wildfire simulation, 2) highly valued resource and asset (HVRA) characterization, 3) exposure analysis, and 4) effects analysis. In this tutorial we give a brief overview of the process and highlight how ArcFuels can be leveraged to complete the exposure analysis and effects analysis steps. For detailed information we suggest you read A wildfire risk assessment framework for land and resource management.
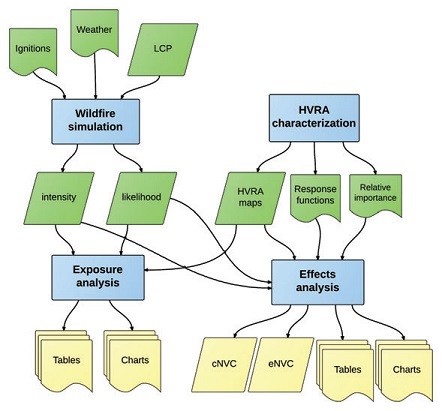
A wildfire risk assessment is comprised of four primary steps: 1) wildfire simulation, 2) highly valued resource and asset (HVRA) characterization, 3) exposure analysis, and 4) effects analysis. Cover figure from Scott et al. 2013.
Both FlamMap5 and FSim are fire behavior modeling systems used to generate the outputs needed to complete a wildfire risk assessment. FSim is based on the same platform as FlamMap utilizing the minimum travel time (MTT) algorithm to model fire spread. Differences are highlighted below. All ArcFuels exercises and example data is from FlamMap5 because it is available for download and fully supported.
| Characteristic | FlamMap | FSim |
|---|---|---|
| Duration | One to few burning periods | Entire fire season |
| Fires considered | Problem fire ignitions | All large fire ignitions |
|
Simulation type |
Single weather scenario | All weather scenario |
| Burn probability | Conditional (single weather scenario) | Annual (full fire season) |
| Source of variation | Ignition locations, fuelscape | Wind speed, wind direction, fuel moisture content, fuelscape, ignition location, ignition probability, containment probability, fire duration |
| Availability / support | Online / Fully supported | By request / Limited support (user group) |
| Complexity | Moderate | High |
| Publication | An Overview of FlamMap Fire Modeling Capabilities (Finney 2006) | A simulation of probabilistic wildfire risk components for the continental United States (Finney et al. 2011) |
A landscape (LCP) file is used to characterize the fuelscape. ArcFuels has four tools to aid in Building LCPs from different data sources: FVS/FFE-FVS or GNN, an attributed Shapefile, and from either full extent Rasters, or by Merging Rasters of various extents.
Fire weather data and ignition sources, for both programs, are processed using Fire Family Plus (Main et al. 1990), which can be opened for external use with the Wildfire Models toolbar in ArcFuels.
The fire size list (FSL) is a text file, with information about the location of each ignition and the final fire size (in acres), for all randomly ignited fires. ArcFuels has the ability to Convert Fire Size Lists to projected shapefiles for further analysis in ArcMap. Along with the FSL, a shapefile of the fire perimeters is an output option.
Burn probability is the likelihood that a wildfire will burn a given point or area over a specified period of time. Burn probability is output as an ASCII file, or as a field in the flame length probability (FLP) text file from FlamMap5 and FSim. ArcFuels can Convert ASCIIs to Rasters for further analysis in ArcMap.
A flame length probability (FLP) file is a comma delimited text file that contains information about burn probability and fire intensity. Fire intensity is expressed as the conditional probability by fire intensity level (FIL) classes represented by flame length.Conditional probability is the probability of the flame length occurring given that at least one of the simulated fires has burned that point on the landscape.The FLP file provides the data to calculate the conditional flame length (CFL), which is the probability-weighted flame length given a fire occurs, and is a measure of wildfire hazard. The Convert FLP form in ArcFuels converts the FLP file to a point shapefile, creates rasters of burn probability, each FIL, and conditional CFL.
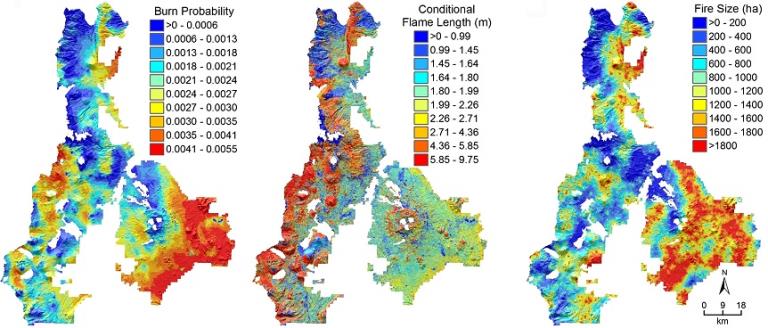
Example maps of burn probability, conditional flame length, and smoothed fire size for the Deschutes National Forest in central OR. Figure 4 from Ager et al. 2012.
Highly valued resources and assets (HVRAs) are simply the things we care about. HVRAs can be both qualitative (e.g. visual quality) or quantitative (e.g. tons of carbon). There are a multitude of HVRAs for national forests, and the choice of a single or multiple HVRAs depends on the project objectives and needs. Some resources have only modest value and may not be analyzed so that efforts can be focused on the more highly valued resources and assets. At the national scale Calkin et al. (2010) categorized HVRAs into: critical habitat, recreation infrastructure, energy infrastructure, air quality, and municipal watersheds. In an assessment of the Lewis and Clark National Forest Thompson et at. (2013) categorized HVRAs into: green trees, wildlife habitat, infrastructure, watersheds and wildland urban interface. The precise HVRAs used in a fuels project depends on the issues at hand as identified in the purpose and need.
HVRA characterization involves 1) mapping the spatial extent, 2) determining the effects of fire of different intensities on each HVRA, and 3) when multiple HVRAs are being assessed the relative importance between them.
Response functions are designed to target the susceptibility of individual HVRAs to fire effects. Response functions can be created from expert opinion to broadly describe fire impacts, or built using fire effects models. Response functions will be specific to the study area in question and the HVRA(s) identified.
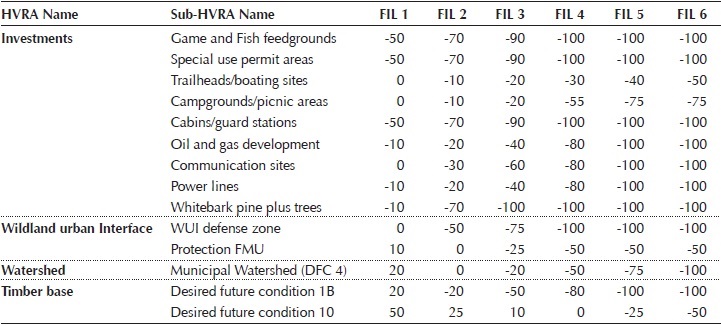
Expert opinion based response functions quantify net value change (NVC) to a given HVRA as the percentage change in the initial resource value resulting from a fire at a given intensity. Intensity is linked to the fire intensity level (FIL) categories output in the wildfire simulations. Stylized response functions address relative rather than absolute change in HVRA value. The change can be either beneficial (positive) or detrimental (negative).
An example of expert opinion based response functions for the HVRAs identified by the Bridger-Teton National Forest (Scott et al. 2013).
Modeled response functions calculate absolute change to a HVRA through fire effects modeling with FVS/FFE-FVS. With FVS/FFE-FVS it is possible to simulate fire at set flame lengths linked to the fire intensity level (FIL) categories output in the wildfire simulations to determine the fire effects on set HVRAs. This has been accomplished to determine the effects of fire on large tree mortality (Ager et al. 2010), carbon pools (Ager et al. 2010), and wildlife habitat (Ager et al. 2007). Other unexplored possibilities include air quality, impacts on stand structure and tree species diversity.
When multiple HVRAs (or sub-HVRAs) exist for a given assessment, they need to be weighted to differentiate the importance of each to be able to analyze them together. Thompson et al. 2013 suggest the following four step process for determining the relative importance of HVRAs.
An exposure analysis is the characterization of wildfire likelihood and intensity where HVRAs occur. I does NOT take into consideration the susceptibility of a given value to fire, but rather it’s exposure, hence exposure analysis.
An exposure analysis summarizes simulated wildfire likelihood (burn probability, extent, and transmission) and intensity (conditional flame length) relative to HVRAs as maps, tables and charts. The Summary Statistics tool in ArcFuels facilitates the process of summarizing this data.
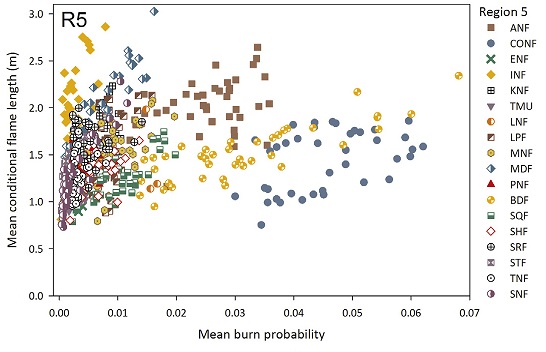
Example of an exposure analysis scatter plot of conditional flame length by burn probability for a random sample of 40 12-digit subwatershed HUCs for each of the National Forests in California. Adapted from figure from Ager et al. 2014.
The effects analysis is where it all comes together. An effects analysis integrates wildfire exposure (likelihood and intensity) and fire effects (susceptibility) to HVRAs, producing a comprehensive measure of wildfire risk, also known as the Net Value Change (NVC).
Because response functions relate to six flame length classes, the FILs are assigned to the appropriate class based on their midpoint values for 20 bin metric FLPs.
The expected NVC (eNVC) is the sum of the cross product of the burn probability, probability of a given fire intensity, and the response function value for each point:
eNVC = ∑ BP * p(fi) * RFi
The calculations for eNCV and cNCV follow the formula below using the attribute field names from the FLP for burn probability (PBurn) and the fire intensity levels (FIL). RF refers to the response function.
FLP - 6 Bin English: eNCV = (PBurn) *[(P(FIL1)* RF1) + (P(FIL2) * RF2) + ... +(P(FIL6) * RF6)]
FLP - 20 Bin Metric: eNCV = (PBurn) *[(P(FIL1)* RF1) + (P(FIL2) * RF2) +(P(FIL3) * RF2) + (P(FIL4) * RF3) +... +(P(FIL19) * RF6) +(P(FIL20) * RF6)]
The conditional NVC (cNVC) is the sum of the cross product of the probability of a given fire intensity, and the response function value for each point:
cNVC = ∑ p(fi) * RFi
6 bin English FLP: c NCV = (P(FIL1)* RF1) + (P(FIL2) * RF2) + ... +(P(FIL6) * RF6)
20 bun metric FLP: c NCV =[(P(FIL1)* RF1) + (P(FIL2) * RF2) +(P(FIL3) * RF2) + (P(FIL4) * RF3) +... +(P(FIL19) * RF6) +(P(FIL20) * RF6)
The Net Value Change form in ArcFuels calculates both the expected and conditional NVC (eNVC and CNVC, respectively) from expert opinion based response functions. The former represents an expectation of NVC that accounts for the probability of a fire, and the latter represents the change in NVC given that a fire occurs. The process combines burn probability and intensity from the FLP files with the response function to calculate a percentage change in the HVRA.
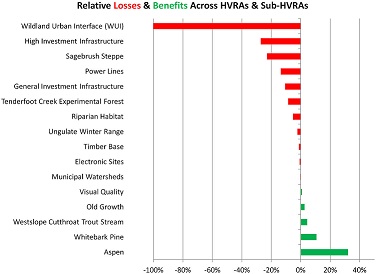
Summary of relative losses and benefits across all HVRAs and Sub-HVRAs for the Little Belts Landscape. Figure 5 from Thompson et al. 2013.
As mentioned above, fire behavior models such as FVS-FFE and FOFEM can be used to develop modeled response functions that contain more detail than the four category functions described above.ArcFuels10 automates the building of response functions using FVS/FFE-FVS and performing the NVC calculations. An FVS/FFE-FVS loss database can be created using the FVS Treatment Analysis form, and then the Expected Impacts form is used to couple the FLP outputs to the FVS/FFE-FVS database to calculate the NVC The calculations are the same as above, except that the units of NVC are not restricted to percentage change, but can take on whatever variables are used in the response functions (e.g., tons carbon, biomass, habitat quality, etc). An example of this approach with spotted owl habitat is shown below, where the NVC for habitat was calculated using FVS-FFE and FlamMap. Note that in this example only negative impacts to habitat were considered, and risk was represented as an expected loss.
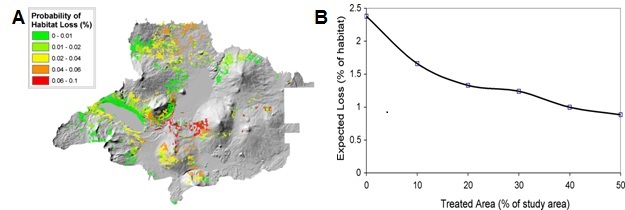
Expected loss map of northern spotted owl habitat (A) and (B) for the Five Buttes study area on the Deschutes National Forest. The figure is adapted from Ager et al. (2007).
When multiple HVRAs are assessed a weighted NVC (wNVC) is used. this includes the ratio of the relative importance to relative extent of each HVRA. Currently, there are no tools in ArcFuels to facilitate these calculations. It is expected to be part of the next version.
The Risk menu contains tools to post-process the FlamMap5 and FSim outputs for further analysis in ArcMap, and tools to aid in wildfire risk assessments.
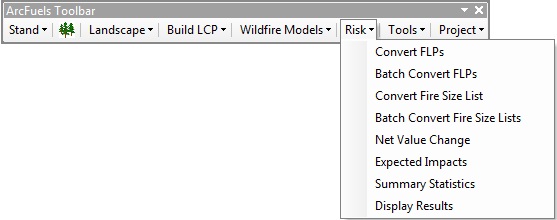
The Risk menu has a drop-down menu with eight options:
Convert & Batch Convert Fire Size List
To start with the first form go to Convert FLPs.